What do quants do all day? Five workflows behind the job titles
Quants spend their working time investigating data, developing and checking models, writing code, managing decisions and explaining results. The balance depends on the role and team. Research, trading, development, pricing and validation can share tools while producing very different outputs.
Consider a message arriving at the start of a work session: “Yesterday's result looks wrong.” For a researcher, that may mean a signal's apparent predictive power disappeared. For a pricing quant, it may mean two systems disagree. For a developer, it may mean a scheduled calculation failed.
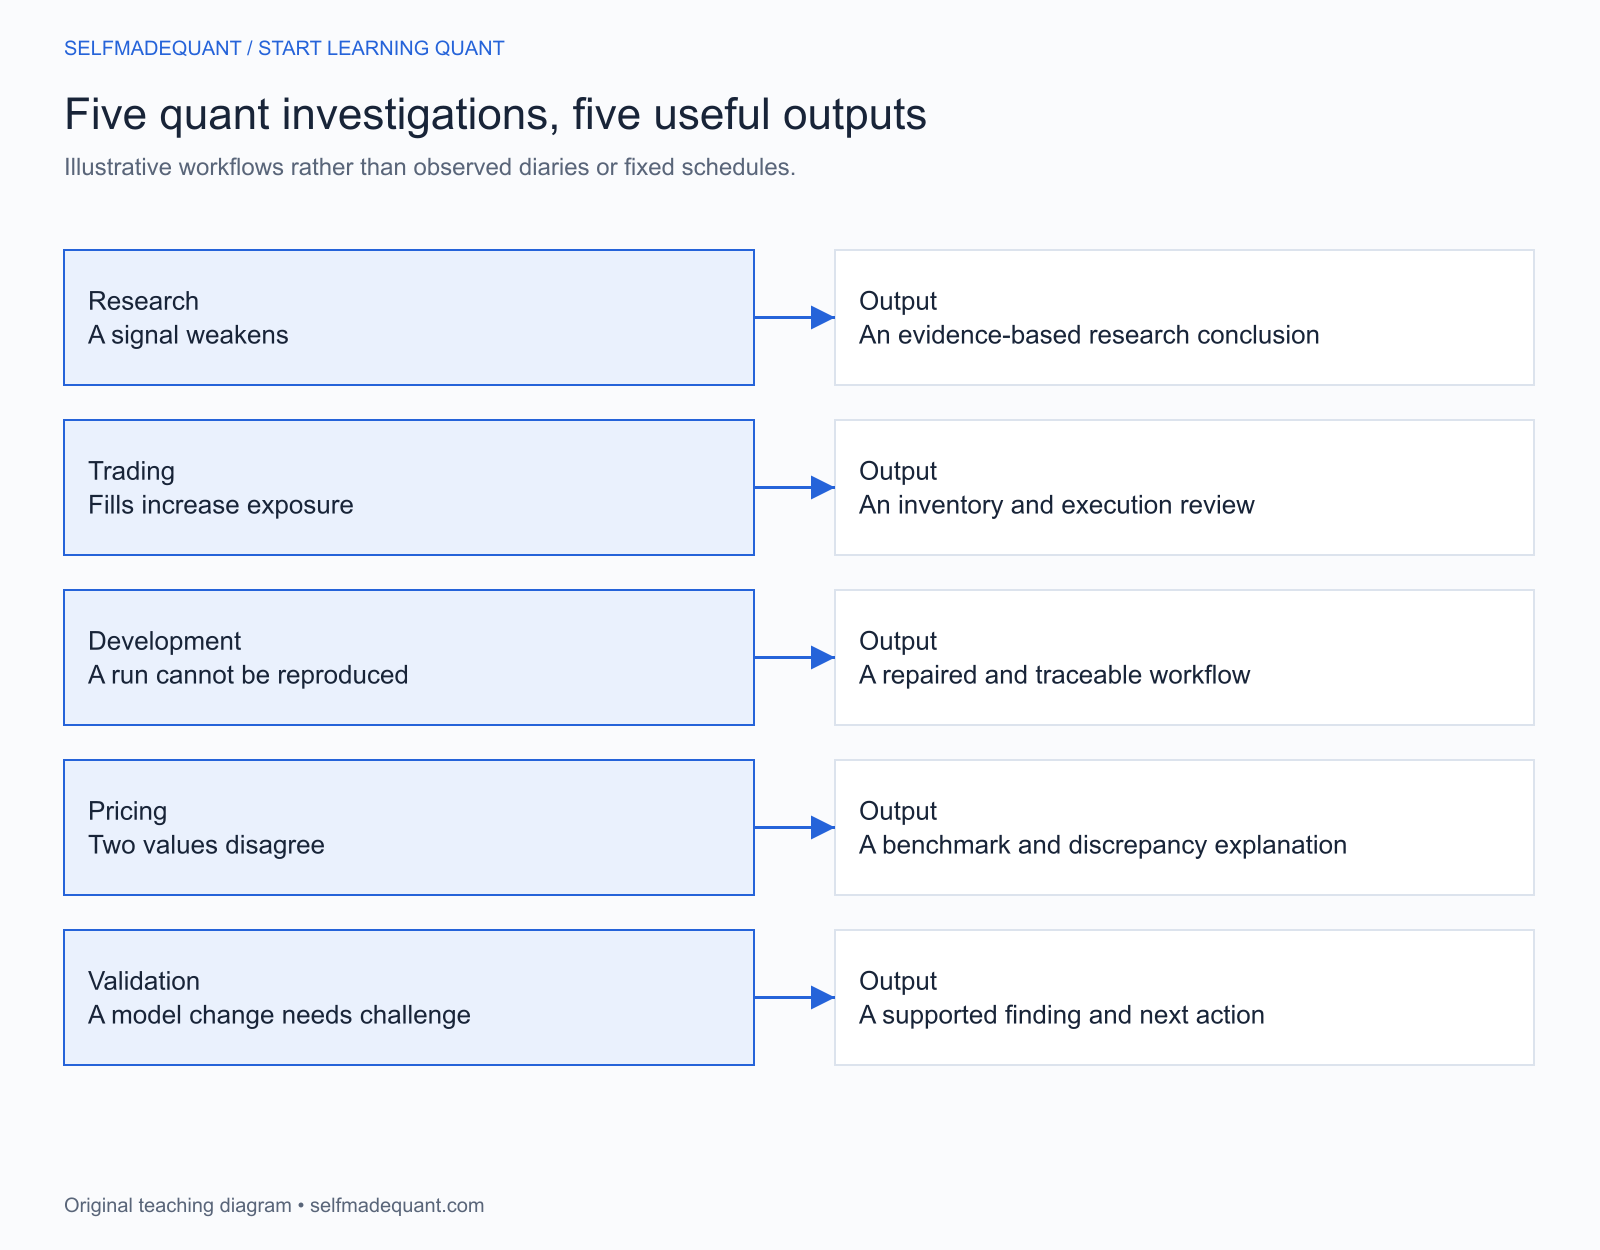
A research day: the signal weakened
A researcher has a model that looked promising during development. It performs poorly on a later period. The first task is to understand the difference without quietly turning the evaluation sample into more training data.
Inspect the experiment
Check the universe, target, feature availability times and data revisions. Was an observation recorded at the close but published later? Did a merge use the latest available record instead of the record available on the historical date? Did the evaluation period introduce a different market regime?
Compare explanations
The researcher makes a small number of diagnostic comparisons: repair a timestamp, use a simpler baseline, inspect a subgroup or check sensitivity to a parameter. Each comparison should have a purpose. Repeatedly changing the model until the evaluation chart improves weakens the evidence.
There may be no successful strategy at the end. The conclusion could be that the feature had little incremental value or that the data cannot answer the original question.
Record the decision
Write the question, method, relevant changes and what would justify another experiment. Save enough information to reproduce the result. The useful output is evidence that changes what the team should believe or test next.
A trading day: the fills changed the risk
A market-making strategy receives several trades on the same side. Inventory rises. A trader investigates whether that reflects ordinary flow, an unusual market event, a pricing issue or a system problem.
Reconstruct the decision state
Start with positions, quotes, fills, risk limits and market conditions. Determine which information was available when each quote was sent. A later price move can help assess a trade, but it was not available to the earlier decision.
Separate the sources of the result
Suppose one contract is bought for 99.95 and an offsetting identical contract is sold for 100.05 before any settlement difference. The cash difference is 0.10 before fees and other costs. That matched pair says little about the risk of holding an unmatched position while waiting for the other trade.
Review and communicate
The trader and colleagues investigate whether to change size, hedge exposure, adjust a parameter or escalate a system issue under the team's controls. The specific action depends on the model and authority of the role.
A development day: yesterday's run cannot be reproduced
A researcher reruns a calculation and gets a different result. The developer needs to distinguish intended variability from an untracked change.
Isolate the failure
Compare the input files, dependency versions, configuration, random generator and intermediate outputs. If the data source changed, a fixed seed cannot restore the old experiment. If the computation uses randomness, seeding one generator does not necessarily control every external library or concurrent process.
Repair the interface
Replace an implicit assumption with an explicit input or validation rule. Reject duplicated timestamps where uniqueness is required. Name the unit of volatility. Store the data snapshot or its identifying version. Make a failed job visibly fail rather than quietly passing stale output downstream.
Check the repair and document it
Use a regression check tied to the failure and a numerical benchmark where appropriate. Explain which earlier results are affected. The deliverable is a reliable workflow that users can understand and repeat.
A pricing day: two option prices disagree
A desk reports a difference between two European option prices. The pricing quant begins with the contract and inputs.
Match what is being valued
Check the underlying, strike, expiry, exercise style, currency and settlement terms. Then compare rate and dividend conventions, volatility units, calendars and time to expiry. Comparing different contracts or inputs is not a test of two implementations of the same model.
Establish a benchmark
Use a tractable case. For a European call under a stated Black–Scholes model, compare an analytic value with a numerical estimate. Monte Carlo estimates vary with the sample and should be interpreted with a standard error. Discretisation can introduce another kind of error in models that require time stepping.
Explain the remaining difference
The outcome might be a code correction, a convention mismatch, a numerical tolerance decision or a model difference that should remain. A useful explanation tells users which discrepancy matters and why.
A validation day: a model change needs challenge
An independent model validator reviews a proposed change. The task is to examine whether the evidence supports the model's intended use and whether the limitations are understood and controlled.
Clarify the decision
What will the model influence: valuation, hedging, limits, capital, forecasting or another process? Which data and assumptions support that use? A model can be mathematically coherent while being unsuitable for the intended decision.
Build an independent comparison
Inspect the documentation and implementation, test selected cases, compare with a challenger and examine sensitivity. Independence means applying meaningful challenge, rather than reproducing the author's preferred chart with the same hidden assumptions.
Write a finding someone can act on
A finding should identify the issue, affected use, evidence, materiality and proposed action. It should also describe what would resolve the issue. “The model is imperfect” gives the owner little to do; a specified failure under a relevant scenario gives them something concrete to investigate.
What these workflows share
Each begins with a question and ends with a decision, explanation or usable output. The middle contains data inspection, calculation, coding, checking and discussion. The order can change, and an urgent incident can interrupt planned work.
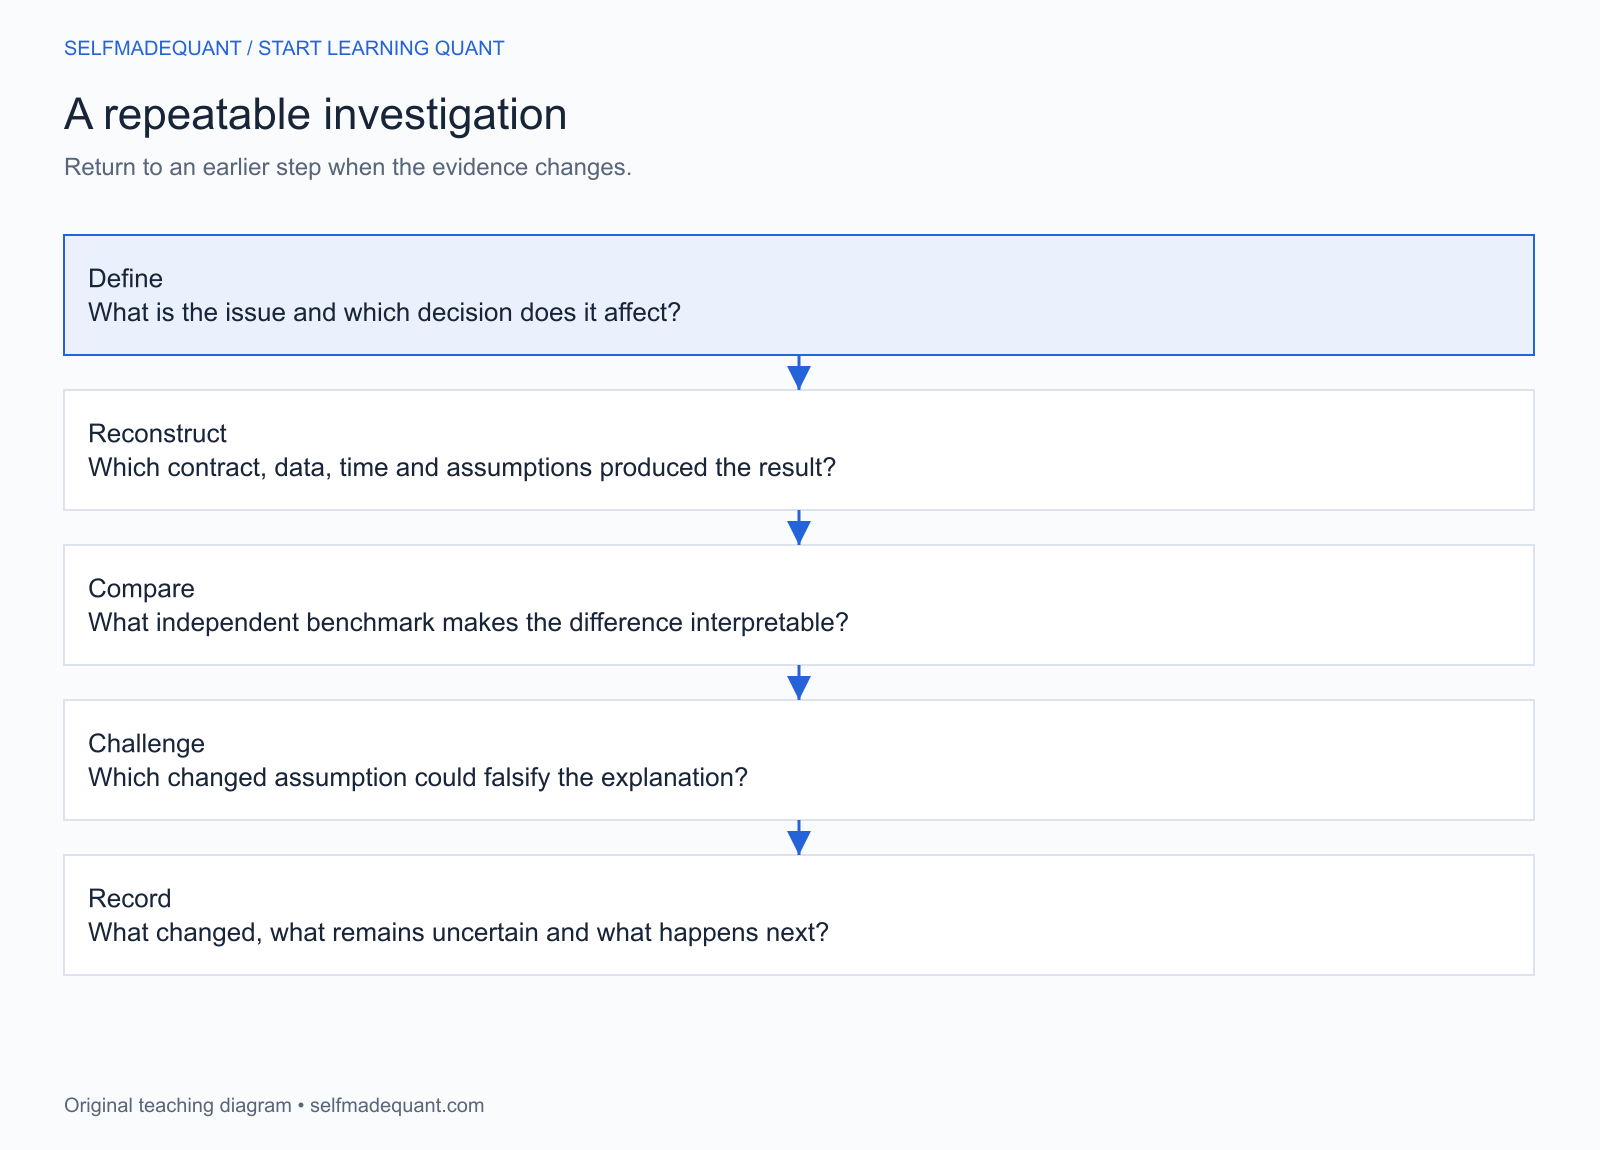
Communication is part of the technical work. An unexplained change in a result can affect several colleagues. A good handoff records the assumption that changed and the evidence behind the new conclusion.
Questions to ask about an actual role
Ask what the person owns, what users depend on their output, and what happens when the result is wrong. Find out whether the role involves market-session coverage, incident responsibilities, research deadlines or formal review cycles.
For junior roles, ask how work is supervised and reviewed. For research, ask how an idea reaches deployment. For engineering, ask which systems the role owns. For pricing or validation, ask how model changes are assessed.
These conversations are more informative than an invented hour-by-hour schedule. A title cannot establish work-life balance, compensation or the amount of discretion you will have.
Use a small project to test your interest
Download the accompanying Python examples
Go deeper with lessons, derivations and worked exercises behind this article.