Quant finance for beginners: where to start and what to learn
Quantitative finance uses mathematics, statistics and programming to make financial decisions: value a contract, test an investment idea, measure risk, or improve how a trade executes. For a beginner, the useful starting point is a small financial question you can calculate, code and explain. You can develop the foundations while deciding which kind of quant work interests you.
Suppose you buy an asset for 100. Tomorrow it is worth 101. That looks like a gain of 1. But what did you pay to trade? When did you know you wanted to buy? How much could you have lost? Would the same decision have worked on a different day?
Those questions turn a price chart into a quantitative investigation. They also explain why learning quant finance involves more than collecting trading indicators or installing a machine-learning library.
What does quantitative finance actually involve?
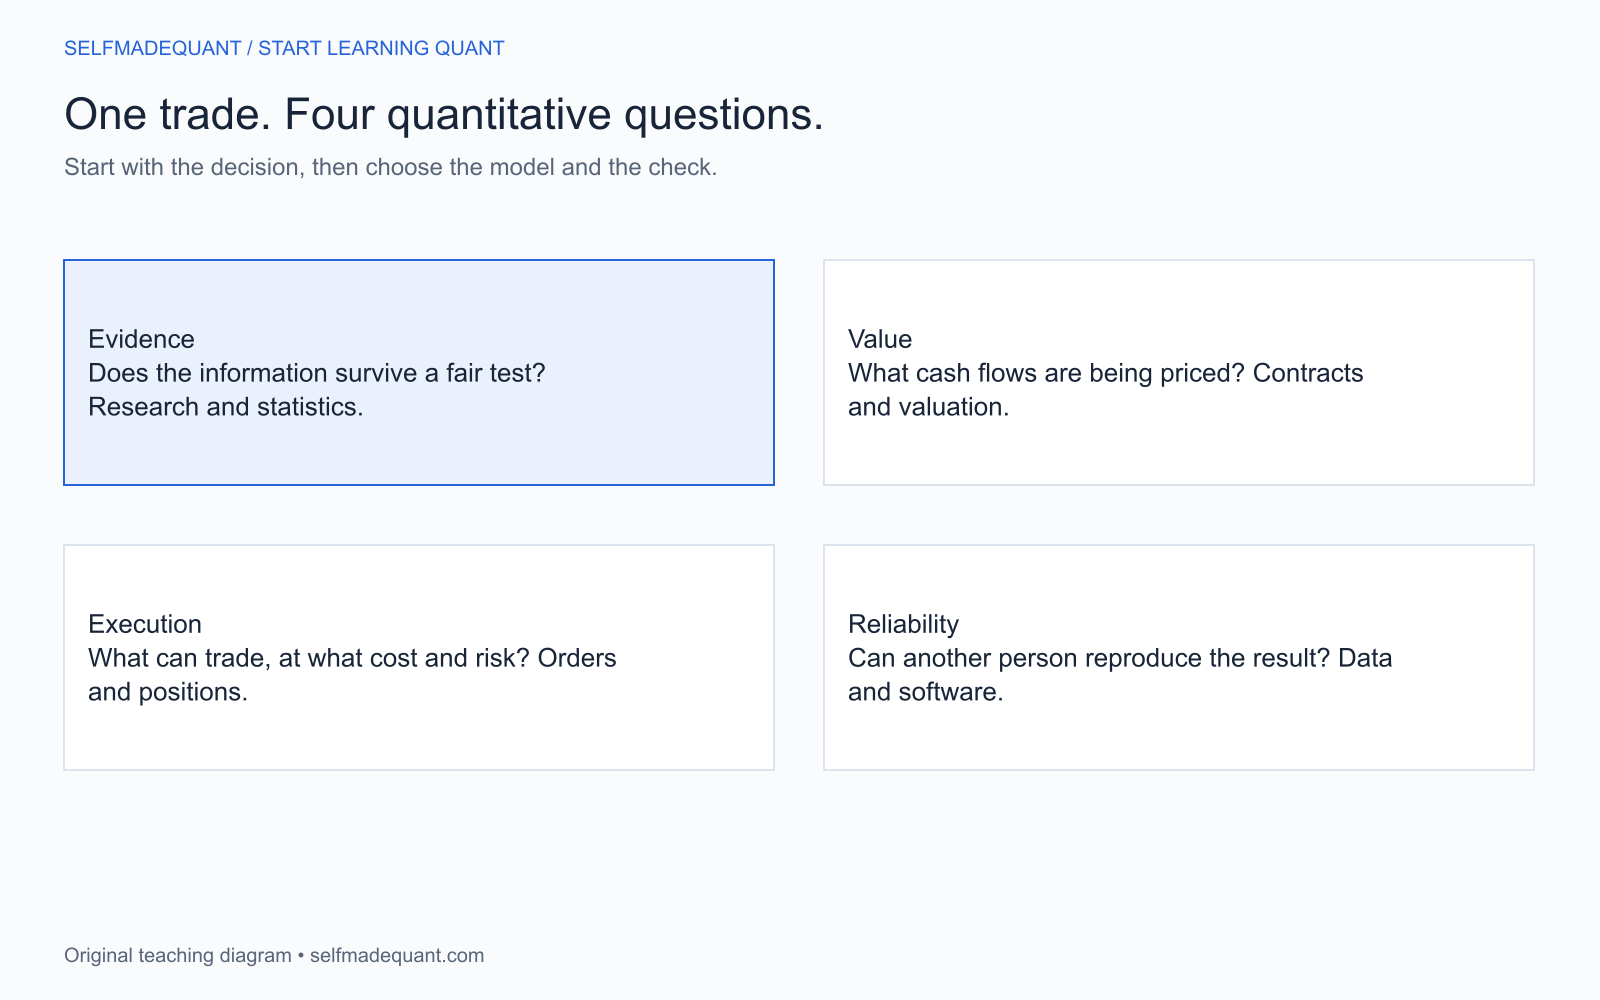
Consider an option: a contract giving its holder a right to buy or sell an underlying asset under specified terms. A pricing quant investigates what that contract is worth under a model and how its value changes. A researcher might investigate information in option prices. A trader manages positions and executions. An engineer implements the data and software used by the team.
You will encounter at least five overlapping areas:
| Area | A question you might investigate | A useful output |
|---|---|---|
| Investment research | Does this relationship survive a fair test? | A reproducible experiment and research memo |
| Trading and execution | How should a desired position become actual trades? | A decision rule and cost analysis |
| Derivatives pricing | How do contract terms and model assumptions affect value? | A checked pricer and sensitivity report |
| Portfolio and risk | Where can this collection of positions lose money? | Exposure, scenario and risk analysis |
| Quant development | Can others run this calculation reliably? | Tested software and traceable data |
Actual job titles and boundaries vary. Quantitative finance appears in banks, asset managers, trading firms, insurers and other organisations. Avoid deciding what the whole field is like from one firm's interview or one person's daily routine.
Three foundations to learn together
You need enough mathematics to describe the problem, enough programming to investigate it, and enough finance to understand what the numbers mean. These foundations can develop together.
Mathematics: uncertainty, change and dependence
Start with algebra, functions, percentages, exponentials and logarithms. Then learn probability, statistics, calculus and linear algebra. The subjects become easier to retain when a financial question gives them a purpose.
Programming: make a calculation repeatable
Python is a practical starting language for numerical experiments, data inspection and prototypes. Learn variables, functions, collections, files and exceptions before treating a notebook as a research system.
Then add arrays, tables and plots. A beginner should be able to explain what one row represents, what each column's units are, and how missing data affect a result. A successful calculation on the wrong dates is still wrong.
Finance: understand the contract and the decision
Learn cash flows, discounting, returns, bonds, equities, forwards, futures and options. Understand the difference between a quoted price, a realised trade and an eventual payoff.
A first calculation: why a loss and a gain do not cancel
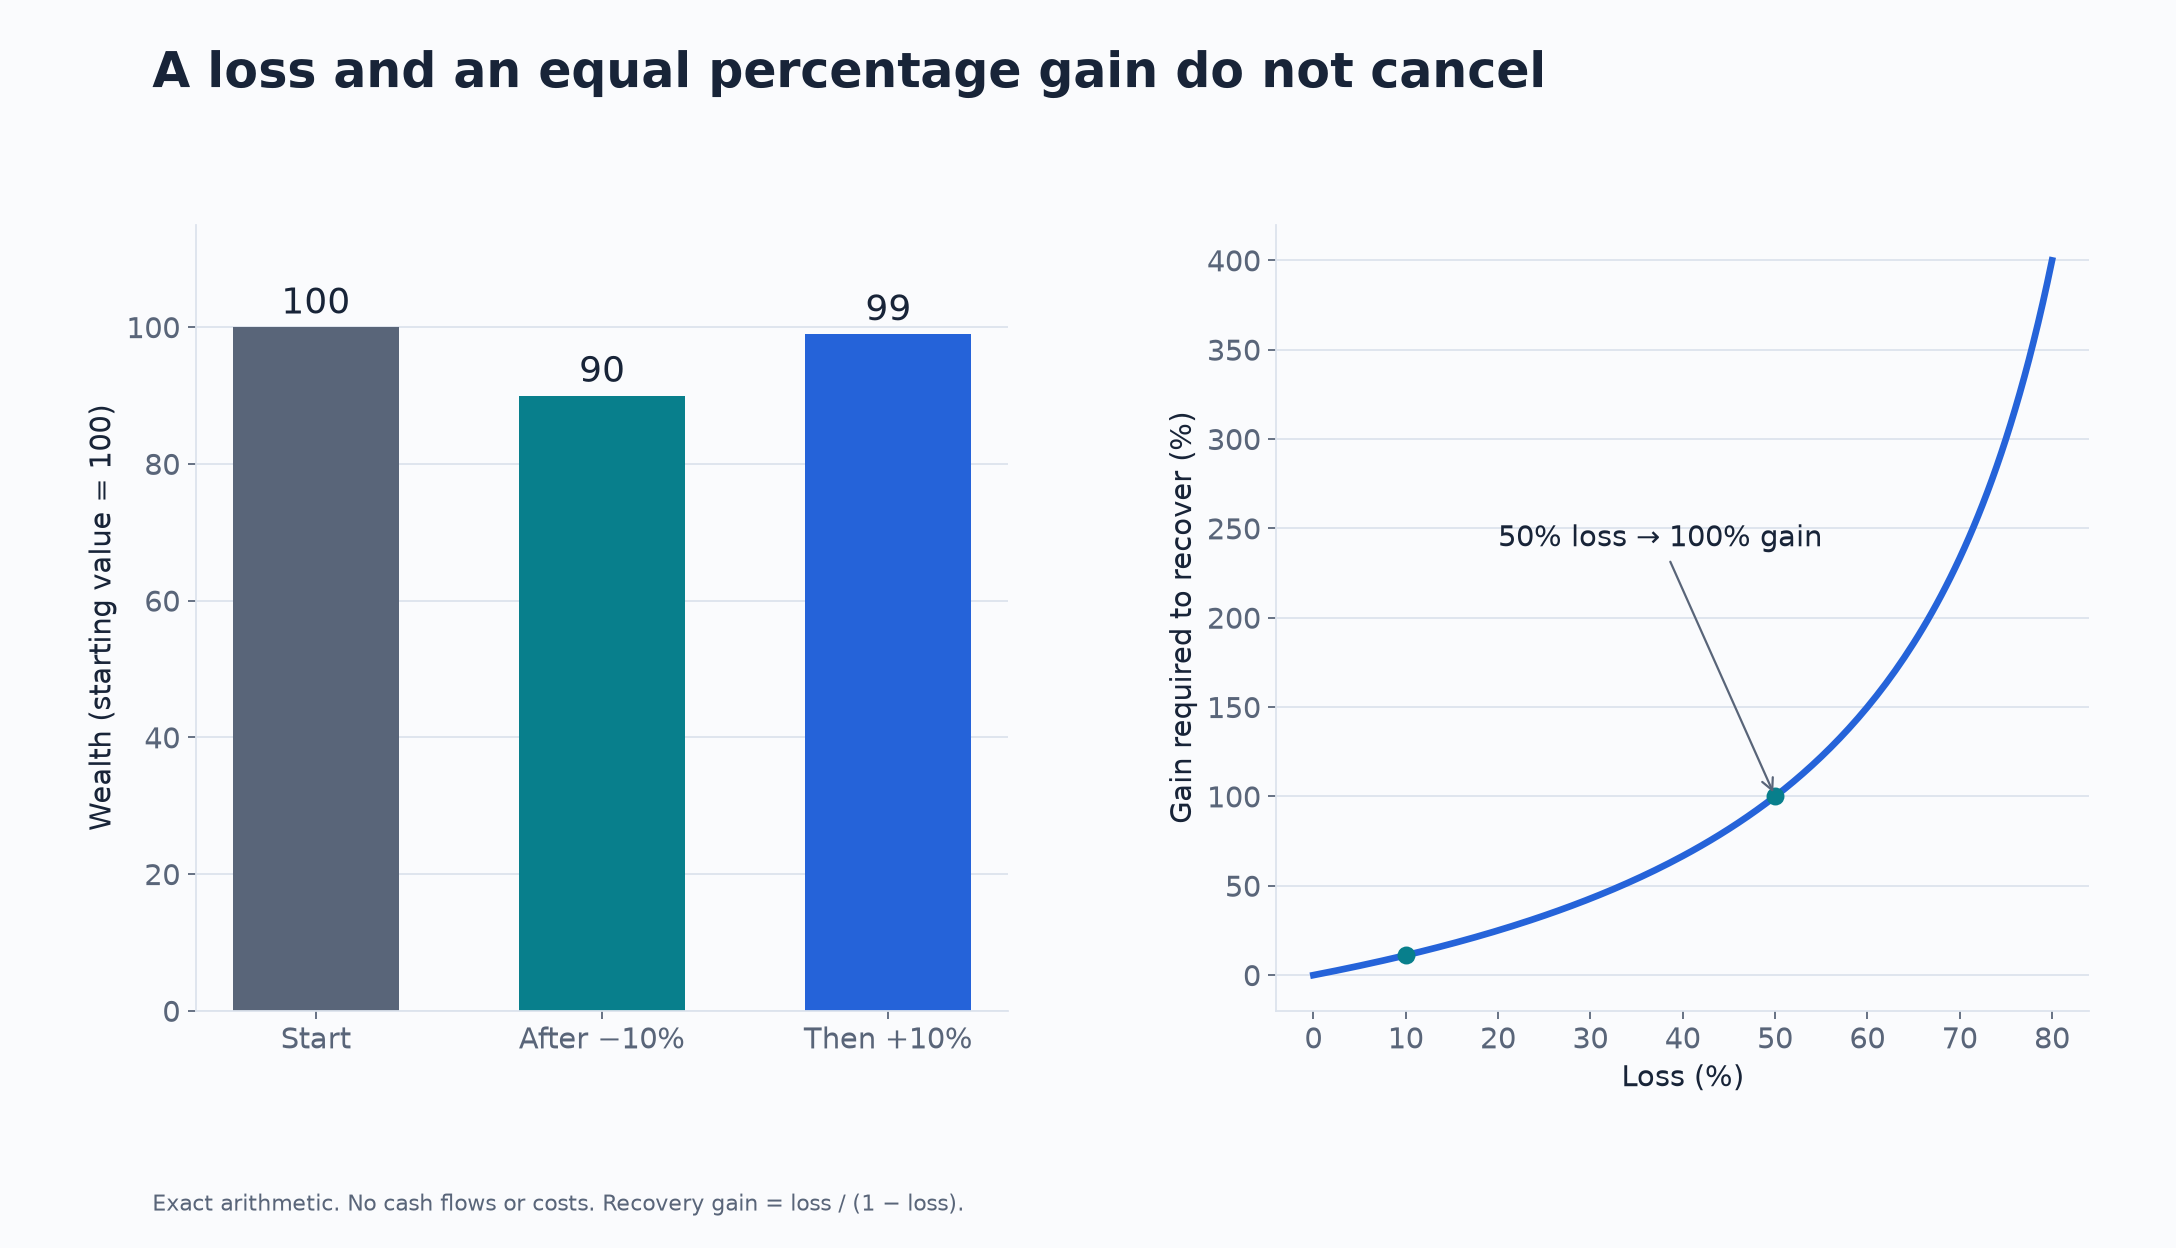
Start with wealth of 100. Lose 10%, then gain 10%:
You finish with 99 because the gain applies to 90, not to the original 100. More generally, a loss of fraction , followed by a gain of the same fraction, leaves wealth multiplied by .
The gain needed to recover from the loss is:
A 10% loss requires an approximately 11.11% gain to recover. A 50% loss requires a 100% gain. Here is a fraction between zero and one; the calculation assumes no additional cash flows or costs.
initial_wealth = 100.0
loss = 0.10
wealth_after_loss = initial_wealth * (1.0 - loss)
wealth_after_gain = wealth_after_loss * (1.0 + loss)
required_gain = loss / (1.0 - loss)

print(f"{wealth_after_loss:.2f}, {wealth_after_gain:.2f}")
# 90.00, 99.00
print(f"{100.0 * required_gain:.2f}%")
# 11.11%Turn the calculation into a first project
Build a return calculator for a short, explicitly labelled illustrative price sequence. Record the prices, calculate simple returns, compound them, and check the final wealth against the first and last price. Assume one asset, full investment, no external cash flows and no costs for this first version.
Then change one assumption. Add a transaction cost, introduce a missing observation, or compare equal cash amounts with equal portfolio weights. Write down why the result changes.
Your deliverable should contain the input data, the calculation, one chart and a paragraph explaining the assumptions. Include a failure case: what happens if a price is zero, a date is duplicated, or your columns use inconsistent units?
External resources worth pairing with practice
Choose one main resource for a subject and use others to resolve specific gaps. Opening six courses at once makes it harder to finish the exercises in any of them.
| Resource | Use it for | Pair it with |
|---|---|---|
| Harvard CS50's Introduction to Programming with Python | Programming fundamentals and problem sets | Small financial calculations you write yourself |
| MIT OpenCourseWare: Linear Algebra, Gilbert Strang | Matrix methods, lectures and exercises | Portfolio weights and covariance calculations |
| Harvard Stat 110, Joe Blitzstein and its YouTube lecture collection | Probability, with lecture-video and practice links | Written solutions and small simulations |
| MIT OpenCourseWare: Finance Theory I | A university introduction to financial theory | Cash-flow, pricing and portfolio examples |
| 3Blue1Brown: linear algebra | Visual intuition from Grant Sanderson's explanations | A textbook or course's exercises |
| QuantEcon: A First Course with Python | Connections between economics, numerical work and code | Reproducing and changing one example |
These links lead to the providers' own resources. Course materials, prerequisites and certificate arrangements differ; inspect the current course page before enrolling. A video can make an idea visible, but solving a new problem is a better test of whether you can use it.
Common beginner questions
Is quant finance the same as algorithmic trading?
Algorithmic trading is one part of the field. Pricing derivatives, measuring credit exposure, validating models and building research infrastructure also use quantitative methods. A programme focused only on trading signals leaves substantial parts of quant finance uncovered.
Do I need a finance degree?
How long does learning quant take?
Should I start with machine learning?
Begin with data, probability, simple models and validation. A complex model cannot repair information that was unavailable at the decision time. Learn to compare a model with a defensible baseline before increasing complexity.
Choose one next step
SelfMadeQuant connects those foundations to programmes, worked lessons and practical investigations. Start with the gap you can identify today, and finish one calculation you can explain tomorrow.
Download the accompanying Python examples
Go deeper with lessons, derivations and worked exercises behind this article.