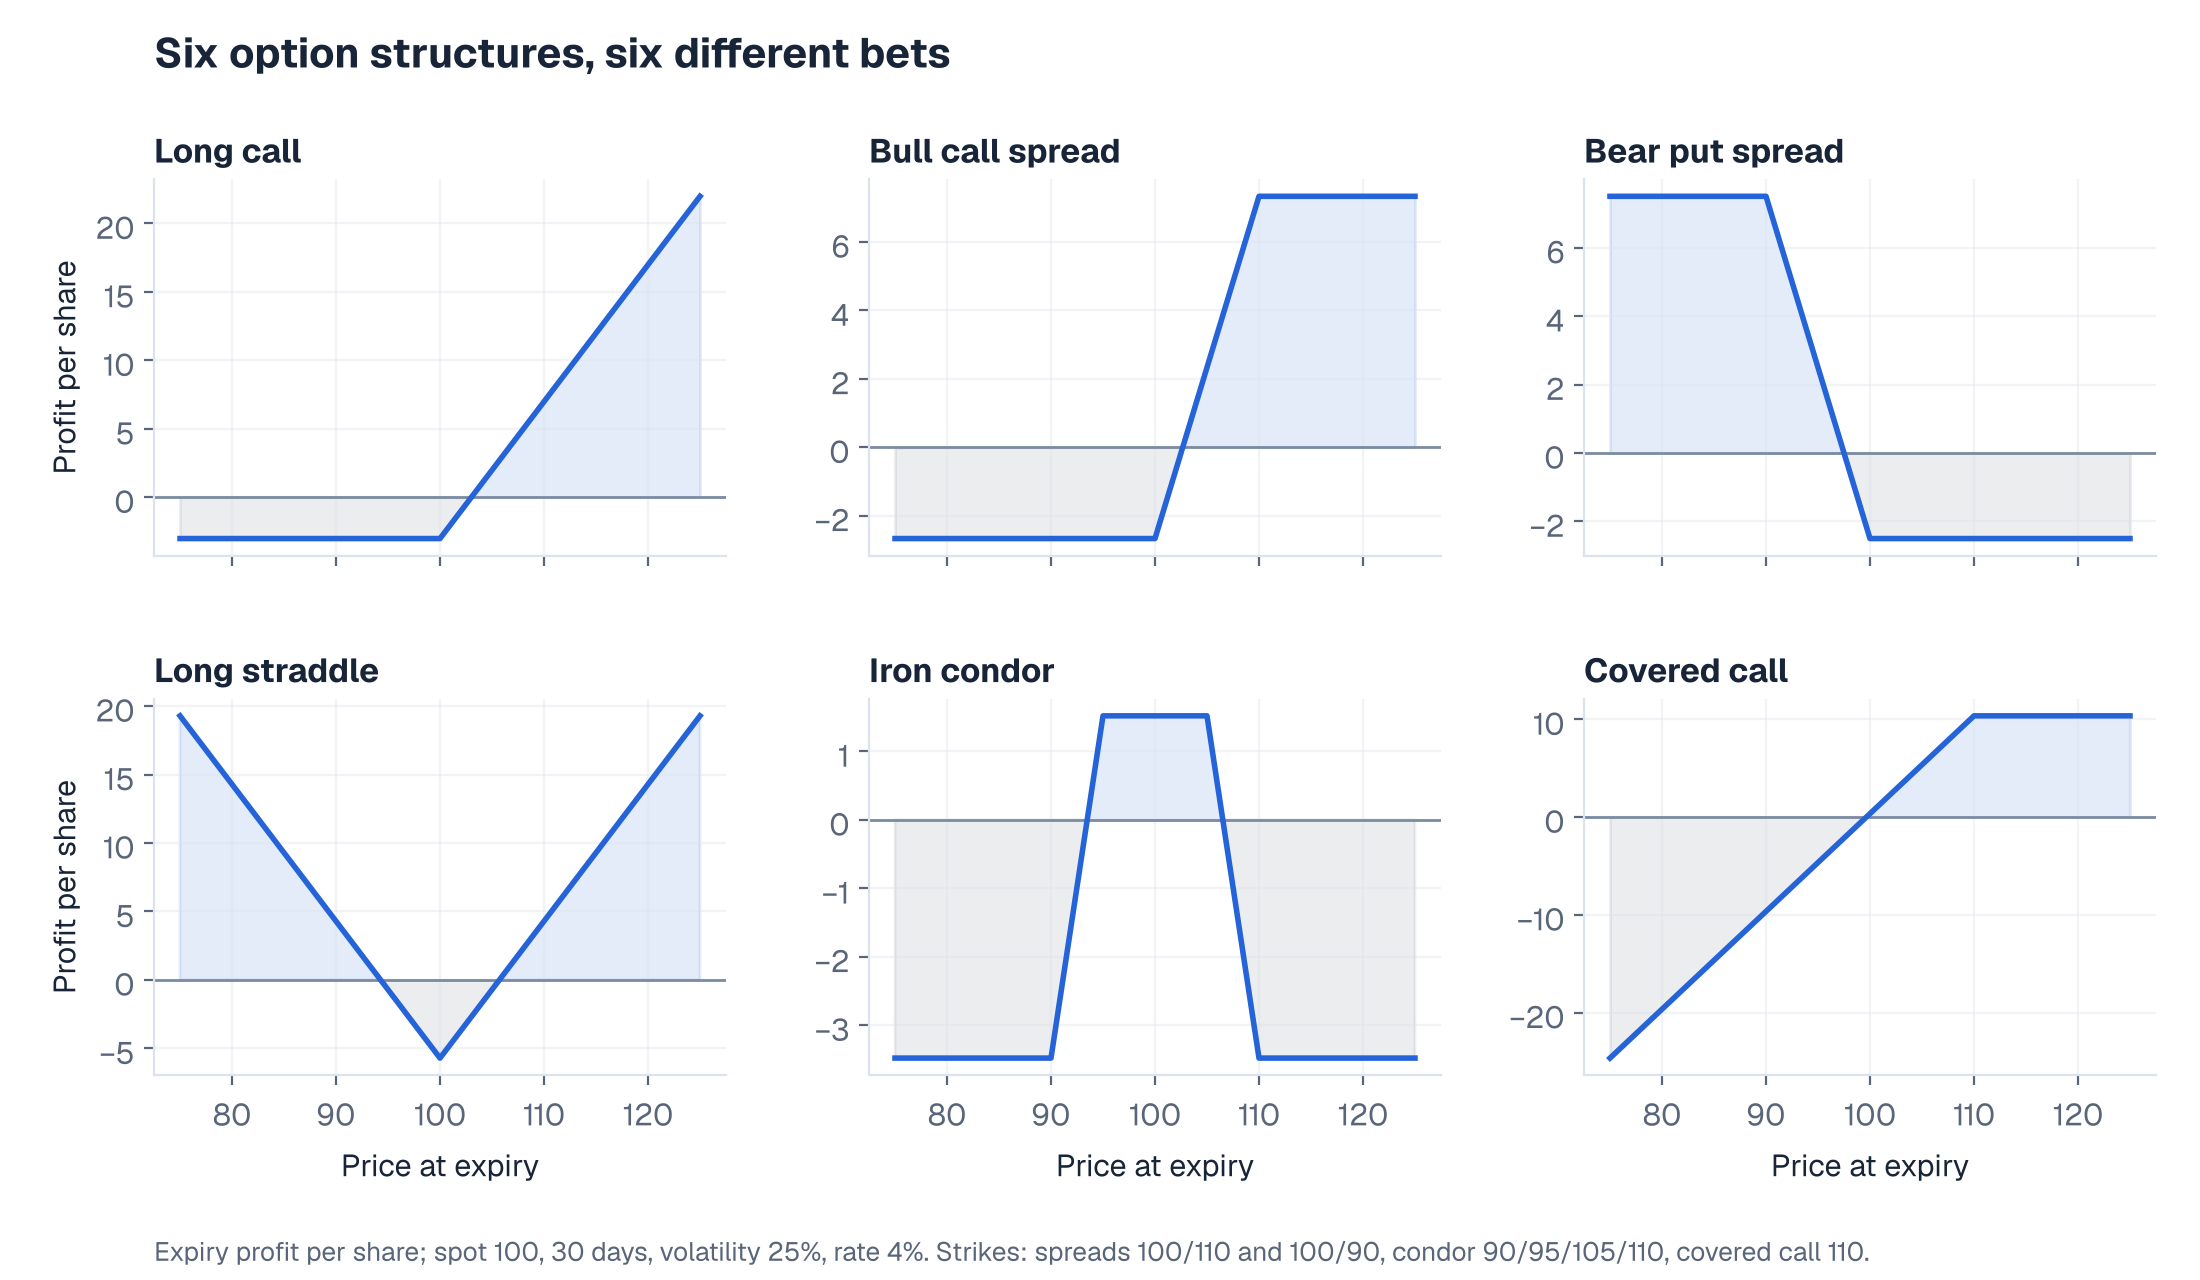
How do you read a payoff diagram?
The horizontal axis is the stock price at expiry; the vertical axis is profit per share after the premium paid or received. Three features matter:
- The breakeven, where the line crosses zero.
- The maximum profit and maximum loss: the flat sections, or the absence of one, which means unlimited.
- The slope between the breakevens, which is the position's delta at expiry.
A diagram shows the position on expiry day only. Before then, the value also depends on time left and volatility, and the curve is smooth rather than kinked. The builder draws both curves so you can see the difference.
Long call: the simplest bullish bet
Buy the 100-strike call for **103.02 you profit, and the upside is unlimited. If it finishes at or below $100, you lose the whole premium.
Bull call spread: cheaper, but capped
- Maximum loss is 100.
- Maximum profit is 2.67 = **110.
- Breakeven is $102.67.
Compared with the long call, you pay 35 cents less and your breakeven is lower, but you give up everything above $110. Use it when you expect a moderate rise, not a rally. The short call also cancels much of the long call's volatility exposure, so the spread is closer to a pure direction bet.
Bear put spread: the same idea for a fall
- Maximum profit is 90.
- Maximum loss is 100.
- Breakeven is $97.50.
It mirrors the bull call spread. A slightly lower cost reflects the positive interest rate, which makes calls a little dearer than puts at the same strike.
Long straddle: betting on movement, not direction
Iron condor: getting paid for a quiet market
- Maximum profit is 95 and $105.
- Maximum loss is 1.52 = **90 or above $110.
- Breakevens are 106.52.
The condor is the opposite bet to the straddle. It collects time decay while the stock stays in the range and loses when it breaks out. The bought wings cap that loss, which is what separates an iron condor from a naked short strangle with unlimited risk. Its profit profile is asymmetric in an uncomfortable way: many small wins and occasional larger losses. Size it for the losses.
Covered call: income in exchange for upside
Own the stock at 0.35**:
- Breakeven falls to $99.65.
- Maximum profit is 110.
- Downside is almost the same as owning the stock: the premium cushions only the first 35 cents of a fall.
The six strategies side by side
| Strategy | Cost (credit) | Maximum profit | Maximum loss | Breakeven(s) |
|---|---|---|---|---|
| Long call 100 | $3.02 | Unlimited | $3.02 | $103.02 |
| Bull call spread 100/110 | $2.67 | $7.33 | $2.67 | $102.67 |
| Bear put spread 100/90 | $2.50 | $7.50 | $2.50 | $97.50 |
| Long straddle 100 | $5.71 | Unlimited | $5.71 | 105.71 |
| Iron condor 90/95/105/110 | ($1.52) | $1.52 | $3.48 | 106.52 |
| Covered call, sell 110 | ($0.35) | $10.35 | $99.65 | $99.65 |
How do you choose between them?
Start from the view, then pick the structure that expresses it most cheaply:
- Direction, with conviction about size: a long call or put.
- Direction, moderate move: a vertical spread, which costs less and has less volatility exposure.
- A big move, unsure which way: a straddle, or a strangle with out-of-the-money strikes for a lower cost.
- No big move: an iron condor or a butterfly, collecting time decay with capped risk.
- Mildly bullish on stock you own: a covered call.
Where to go next
- What does an option price actually mean?
- A Python option pricing lab
- The Strategy Lab has payoff diagrams and monthly roll backtests for all 58 option structures in 151 Trading Strategies, starting with the covered call.
- The option trading strategies lesson.
References
Premiums in this article are Black–Scholes values with the stated inputs and no dividends. Market prices differ because of the volatility smile, bid–ask spreads and early-exercise features.