Ignoring the base rate is called base-rate neglect. It is the most common error in probability interview questions and one of the most expensive in research. It turns a "highly accurate" crash detector, fraud flag or earnings-surprise model into a stream of false alarms. This guide works through the arithmetic with one running example, then shows the faster odds method interviewers like.
What does a signal's hit rate actually tell you?
Suppose a model flags days on which a stock will fall more than 3%. On historical data it has two properties:
- It fires on 80% of the days the large fall happens. This is the hit rate, also called sensitivity or recall.
- It fires on 10% of the days the fall does not happen. This is the false-alarm rate, or one minus specificity.
Count 1,000 days. On 50 of them the fall happens and the model fires on 40. On the other 950 it fires falsely on 95. So it fires 135 times, and only 40 of those are real:
The model is right less than a third of the time it fires. Nothing is wrong with it. The false alarms come from the much larger pool of ordinary days, and 10% of a big number beats 80% of a small one.
How does the base rate change the answer?
Keep the signal fixed (80% hit rate, 10% false alarms) and vary only how common the event is:
| Base rate | P(event | signal fires) |
|---|---|
| 1% | 7.5% |
| 5% | 29.6% |
| 10% | 47.1% |
| 20% | 66.7% |
| 50% | 88.9% |
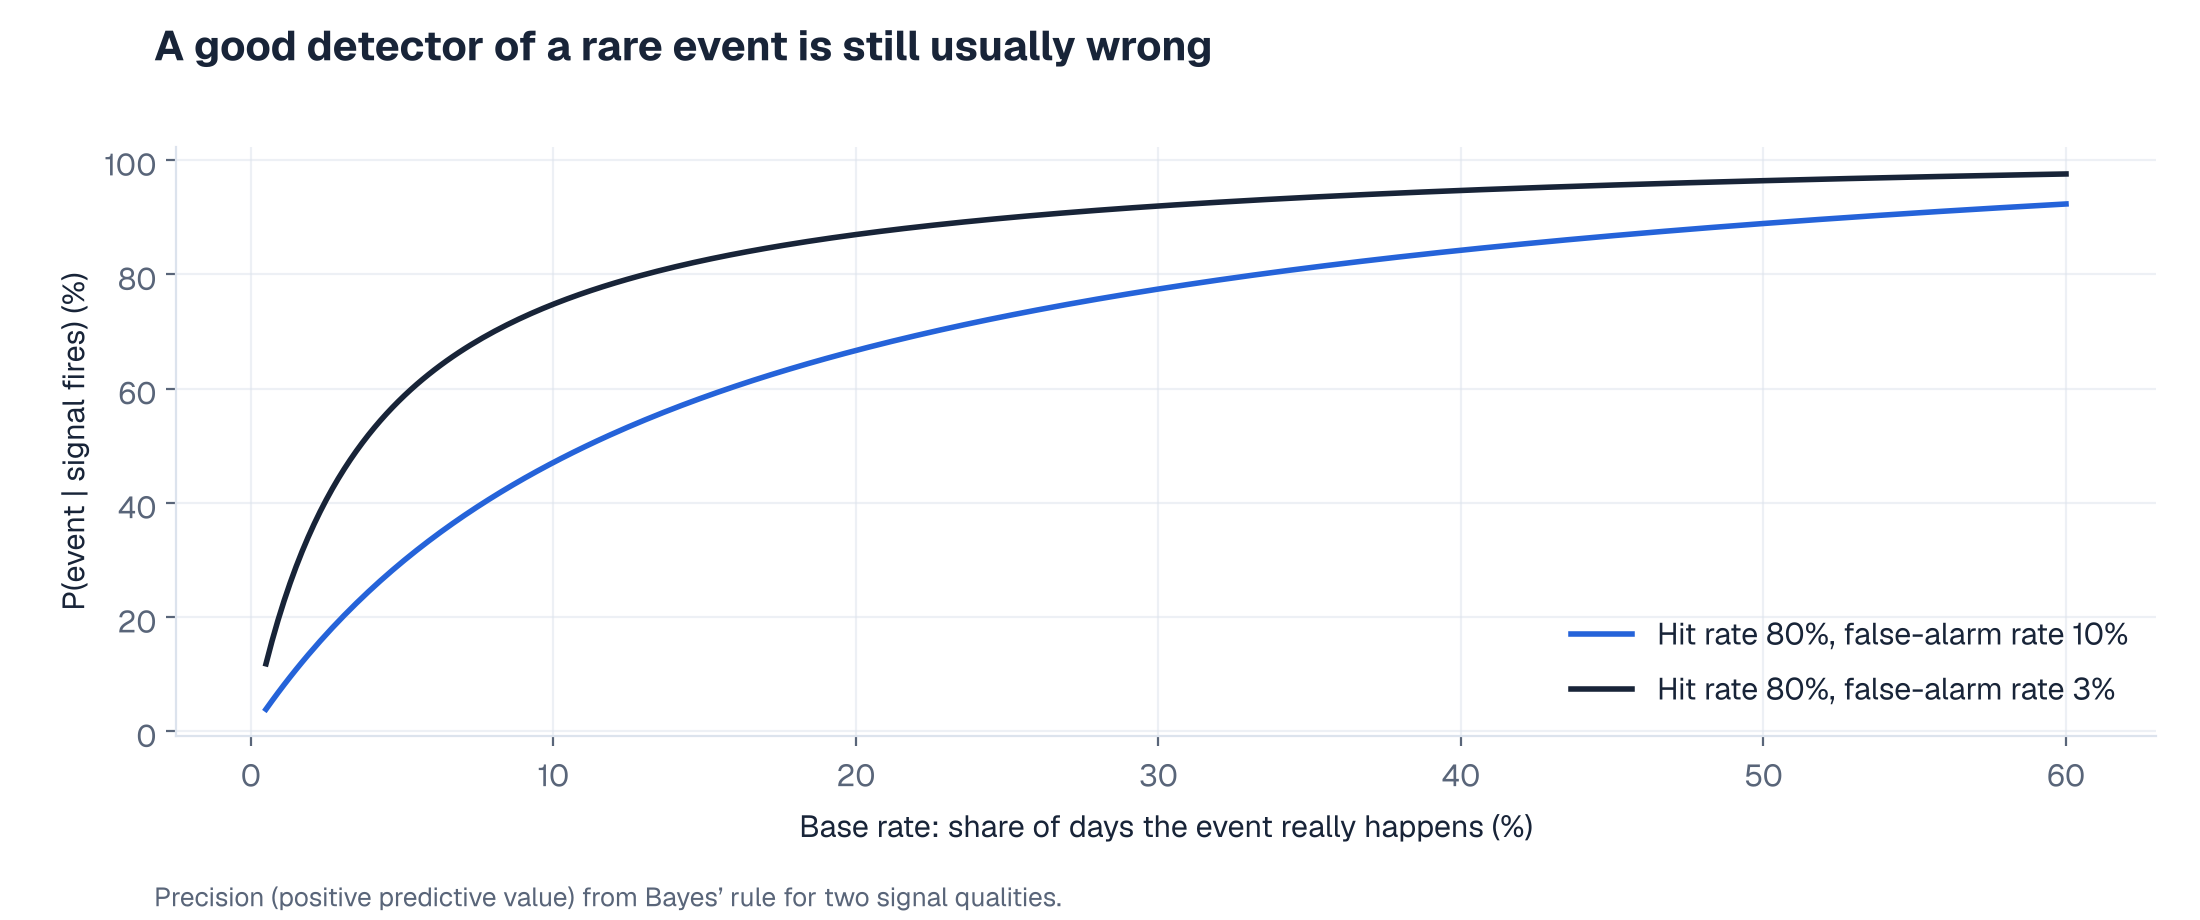
The chart also shows the second lever. Cutting the false-alarm rate from 10% to 3% lifts precision at a 5% base rate from 29.6% to 58.4%. For rare events, reducing false alarms matters far more than catching a few more true cases.
Is there a faster way to do the calculation?
Yes: the odds form of Bayes' rule. Convert the prior to odds, multiply by the likelihood ratio, and convert back:
With a 5% base rate the prior odds are 5 : 95. The likelihood ratio is 0.80 / 0.10 = 8. Posterior odds are 40 : 95, which is a probability of 40/135 ≈ 29.6%, the same answer with one multiplication.
When does combining signals go wrong?
The multiplication assumes the signals are conditionally independent: once you know whether the event happens, one signal tells you nothing about the other. Trading signals rarely satisfy this.
- Shared inputs. Two momentum indicators built from the same price history are close to the same signal. Multiplying their likelihood ratios counts one piece of evidence twice.
- Shared causes. Volume spikes and volatility spikes often fire together because one event drives both.
- Data snooping. If the second signal was chosen because it agreed with the first on the same sample, its likelihood ratio is overstated.
A practical check is to estimate the joint behaviour directly: how often both fire on event days and on non-event days. If the joint false-alarm rate is close to the single-signal rate, the second signal adds little.
Where does base-rate neglect show up in quant work?
Common mistakes
- Confusing P(signal | event) with P(event | signal). These are different conditional probabilities. The hit rate is the first; what you trade on is the second.
- Evaluating on balanced data. Resampling to 50% events for training is fine. Reporting precision on that sample is not, because it hides the real base rate.
- Ignoring the cost asymmetry. Even a low-precision signal can be worth acting on if a hit pays far more than a false alarm costs. Precision is an input to the decision, not the decision.
Where to go next
- Conditional probability for quant interviews
- Machine learning vs a simple trading baseline
- Look-ahead bias in backtesting
- The Bayesian reasoning lesson, for priors that are distributions rather than single numbers.
References
All numerical examples in this article are illustrative and computed exactly from the stated rates.