How to present a quant project in an interview: evidence, results and limitations
Present a quant project by explaining the decision you investigated, the benchmark you used, a calculation you checked independently, the main result and the assumption that most limits it. Be precise about what you built yourself and what came from a reference implementation.
A portfolio of projects is easier to assess when each entry has that structure. A model name or dashboard screenshot gives an interviewer little evidence of how you reason. A reproducible calculation, a changed assumption and a supported conclusion give them something specific to question.
Build an evidence trail that fits on one page
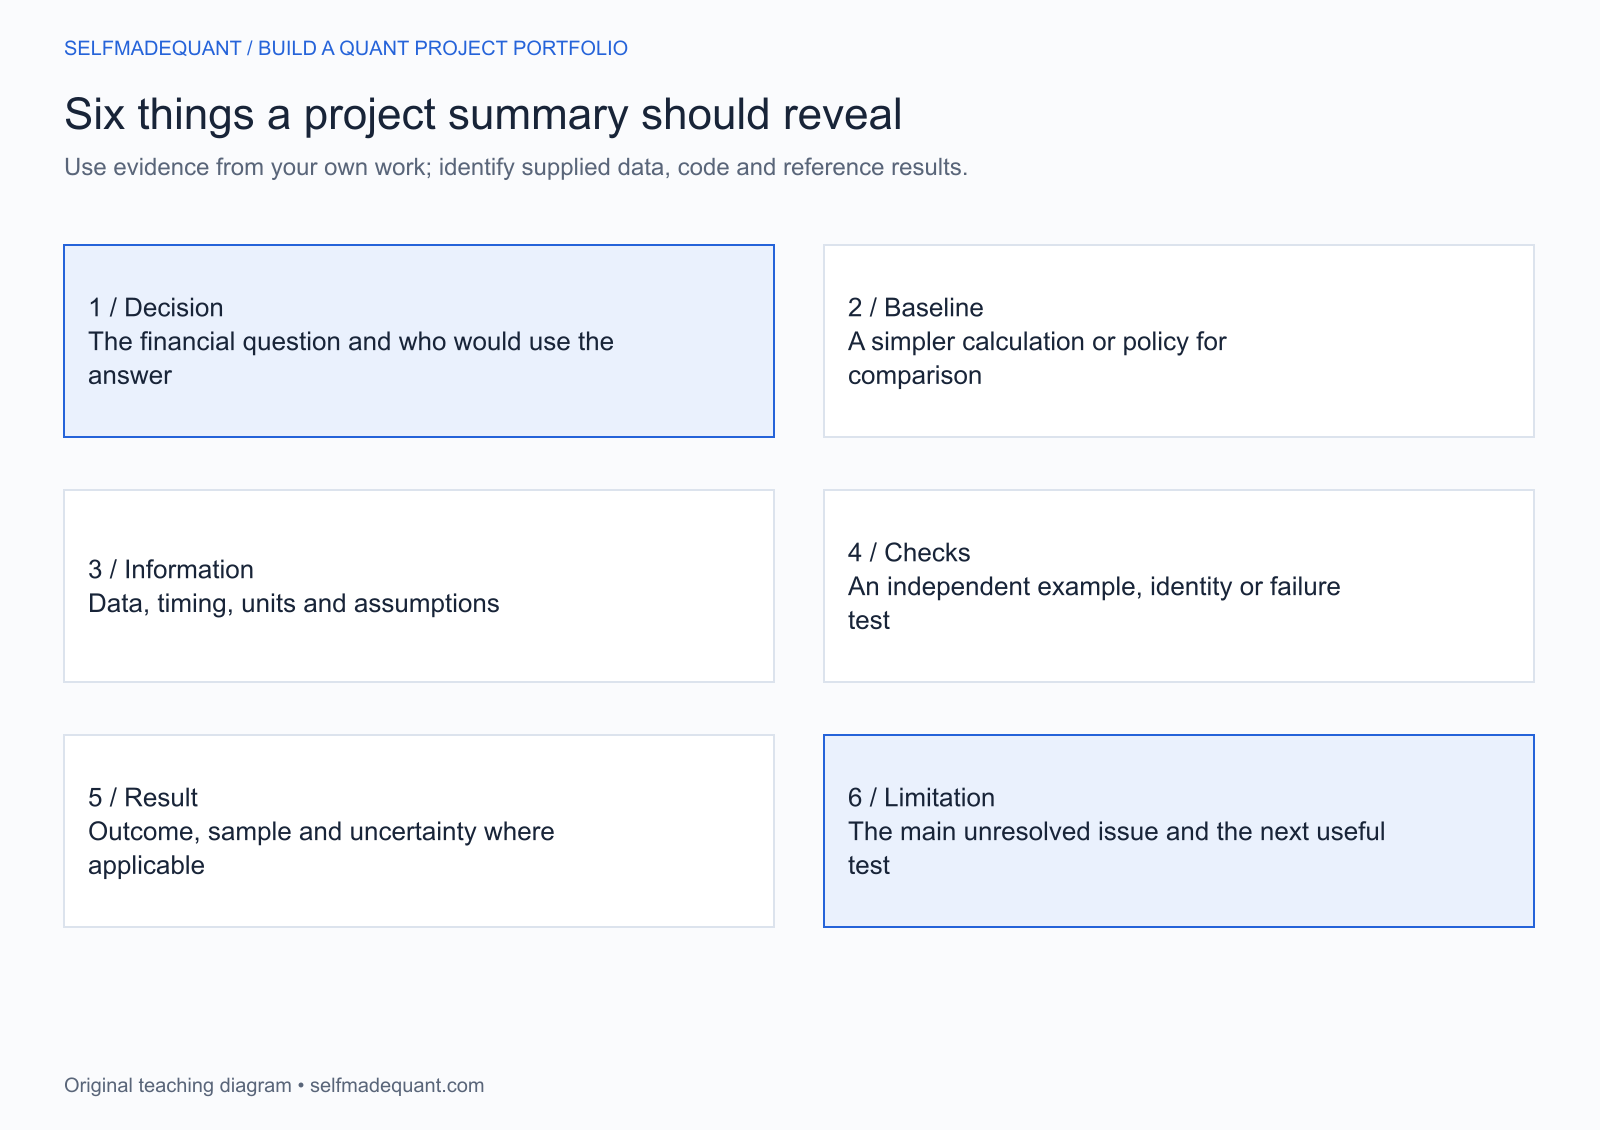
For each project, prepare a short summary with six elements:
- Decision: the financial question and who would use the answer.
- Baseline: the simple calculation or policy used for comparison.
- Information: what data were available at each decision, with important assumptions.
- Checks: an identity, independent example or failure test that supports correctness.
- Result: the measured outcome, sample and uncertainty where applicable.
- Limitation: the most consequential unresolved issue and the next useful test.
Attach the relevant figure and a clear reproduction path. Keep the full derivation or notebook available for follow-up rather than reading code line by line in the opening explanation.
Example 1: explain portfolio risk before showing an optimiser
A concise explanation of the reference example is:
The five assets each receive 20% of capital, but their risk contributions differ. In the frozen historical window, JPM contributes about 24.2% of portfolio volatility risk and WMT about 16.1%. The contributions reconcile to the portfolio total. This is a description of that selected sample, whose universe has a survivorship limitation; it is not a current forecast.
That answer names the distinction, result, check and scope. If you use this example in your own interview, first reproduce it and be able to derive the contribution formula. Do not describe a supplied result as an experiment you independently designed.
Example 2: a good-looking backtest needs a starting-position explanation
The important finding is why the rule leads: it starts in cash after a sell signal formed before the evaluation window and avoids the subsequent long decline. The reference report’s start-date investigation shows that the headline does not describe a stable advantage across all entry dates.
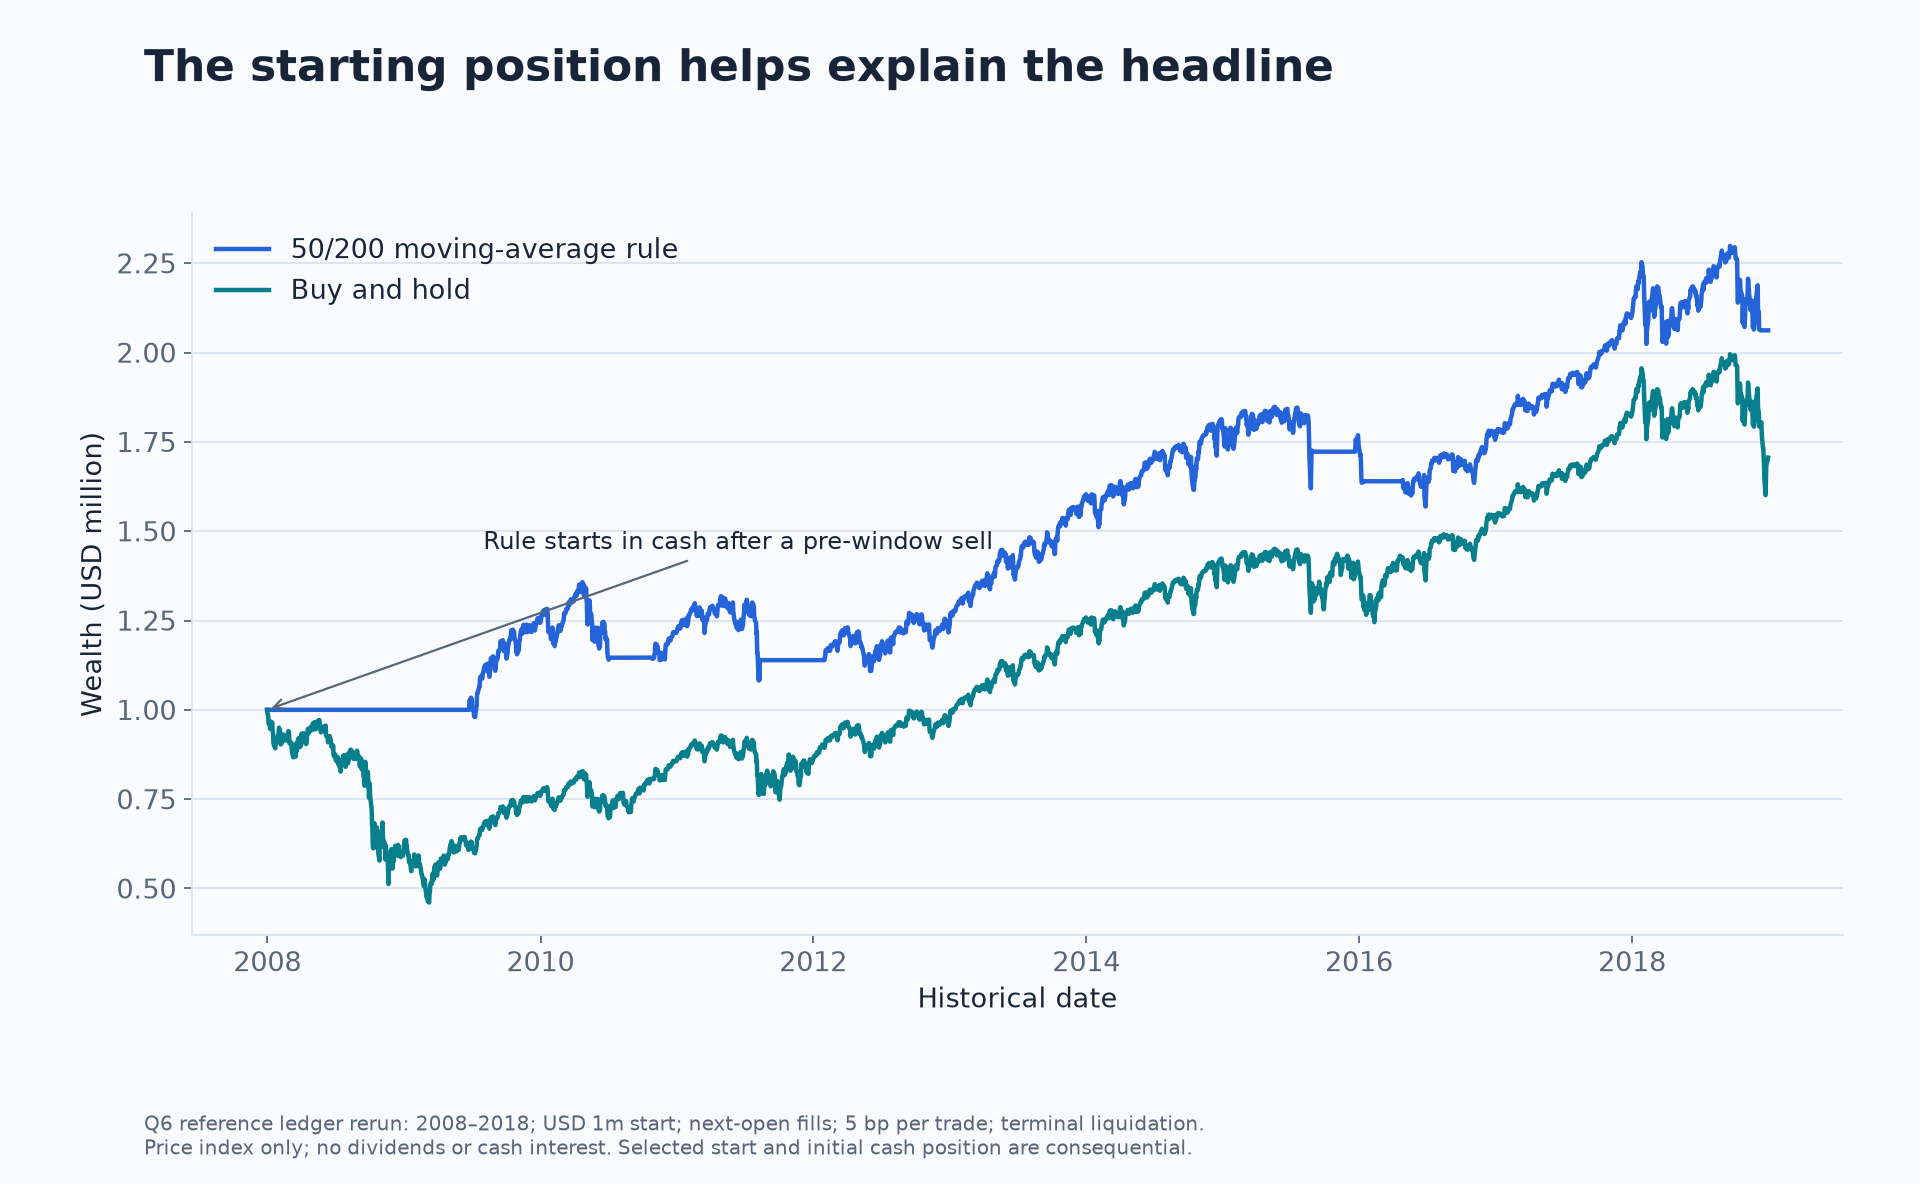
An interview explanation should therefore include the pre-window signal, warm-up data and benchmark entry convention. Saying “the rule beats the market” would hide the assumption that explains much of the result.
The series is a price-index backtest, with no dividends or interest in its base ledger. It uses assumed fees and a limited rule family. The project also investigates unreliable early open prices. Those are limitations to discuss with the chart, rather than details to reveal only if challenged.
Have one calculation you can reconstruct without the notebook
Q6’s small illustrative fixture starts with 1,000, buys at 104 with a 1% fee and sells at 99 with another 1% fee. Fee-aware sizing gives
cash, buy_price, sell_price, fee = 1000.0, 104.0, 99.0, 0.01
units = cash / (buy_price * (1 + fee))
final_cash = units * sell_price * (1 - fee)
print(f"units={units:.4f}, final cash={final_cash:.2f}")
# units=9.5202, final cash=933.07
The 1% fee is an intentionally large illustrative input for checking the arithmetic. It differs from the historical backtest’s five-basis-point assumption. Mixing those two fixtures would make the explanation internally inconsistent.
For an execution project, reconstruct a small book walk instead. For a pricing project, check parity or a limiting case. For Monte Carlo, identify the independent observation and calculate its standard error. Choose a calculation central to your actual contribution.
Example 3: a narrow error bar does not settle a model question
An interviewer may ask why you needed so many paths. A useful answer explains the sampling target and cost, then identifies what more paths cannot fix. An incorrectly monitored barrier or an unsuitable volatility assumption remains wrong even if the simulation standard error is small.
Antithetic sampling provides a good follow-up. The independent observations are pair averages, and the method’s effectiveness depends on the payoff. A monotone call and a straddle need not have the same covariance between paired outcomes. Do not generalise a successful variance reduction from one payoff to every contract.
Tailor the evidence to the role
For development and validation, show the module boundary, input checks, reproducibility and recovery behaviour. A deliberate future-data shock that leaves earlier decisions unchanged is stronger evidence than saying the code “avoids look-ahead.” A failed replay recorded with a reproducible recovery path is stronger evidence than only showing a successful run.
These are preparation choices, not claims that every employer asks the same questions. Use the actual role description to decide which part of your project deserves depth.
Be explicit about your contribution
State which parts came from supplied data, research papers, a library, a team or AI assistance. Then identify what you personally reproduced, changed, tested and explained. A small independent extension is easier to defend than a large borrowed system presented as original work.
A reference implementation can be a strong starting point. Your contribution might be a new failure test, a justified change of universe, an independent benchmark or an investigation into a result that does not reproduce. Record the baseline and the difference so another person can inspect both.
Keep observed results, simulated inputs and deliberately injected failures separate. Q9’s illustrative prediction-market quotes should never be presented as a live market discovery. A replay of a historical order book should never be described as realised fills from your own trading account.
A compact project-summary template
Use the following structure after you have done the underlying work:
Question: Which decision did I investigate, for which instrument or portfolio?Baseline and data: What did I compare against, on which sample, using information available when?My contribution: Which calculation, implementation or experiment did I personally add or verify?Check: What independent identity, small example or failure test supports correctness?Result: What changed relative to the benchmark, and how uncertain is that finding?Limitation and next test: What most restricts the conclusion, and which experiment would address it?
Make the result quantitative where the evidence supports it. Avoid inventing precision for a qualitative finding or treating a single historical comparison as a universal rule. Use the full report for details that do not fit into the opening explanation.
Practise the changed-assumption follow-up
After one uninterrupted explanation, ask a practice partner to change an assumption: delay the input, increase costs, shorten the sample, remove a hedge instrument or make a constraint infeasible. Explain which calculation and conclusion must be revisited before running the code.
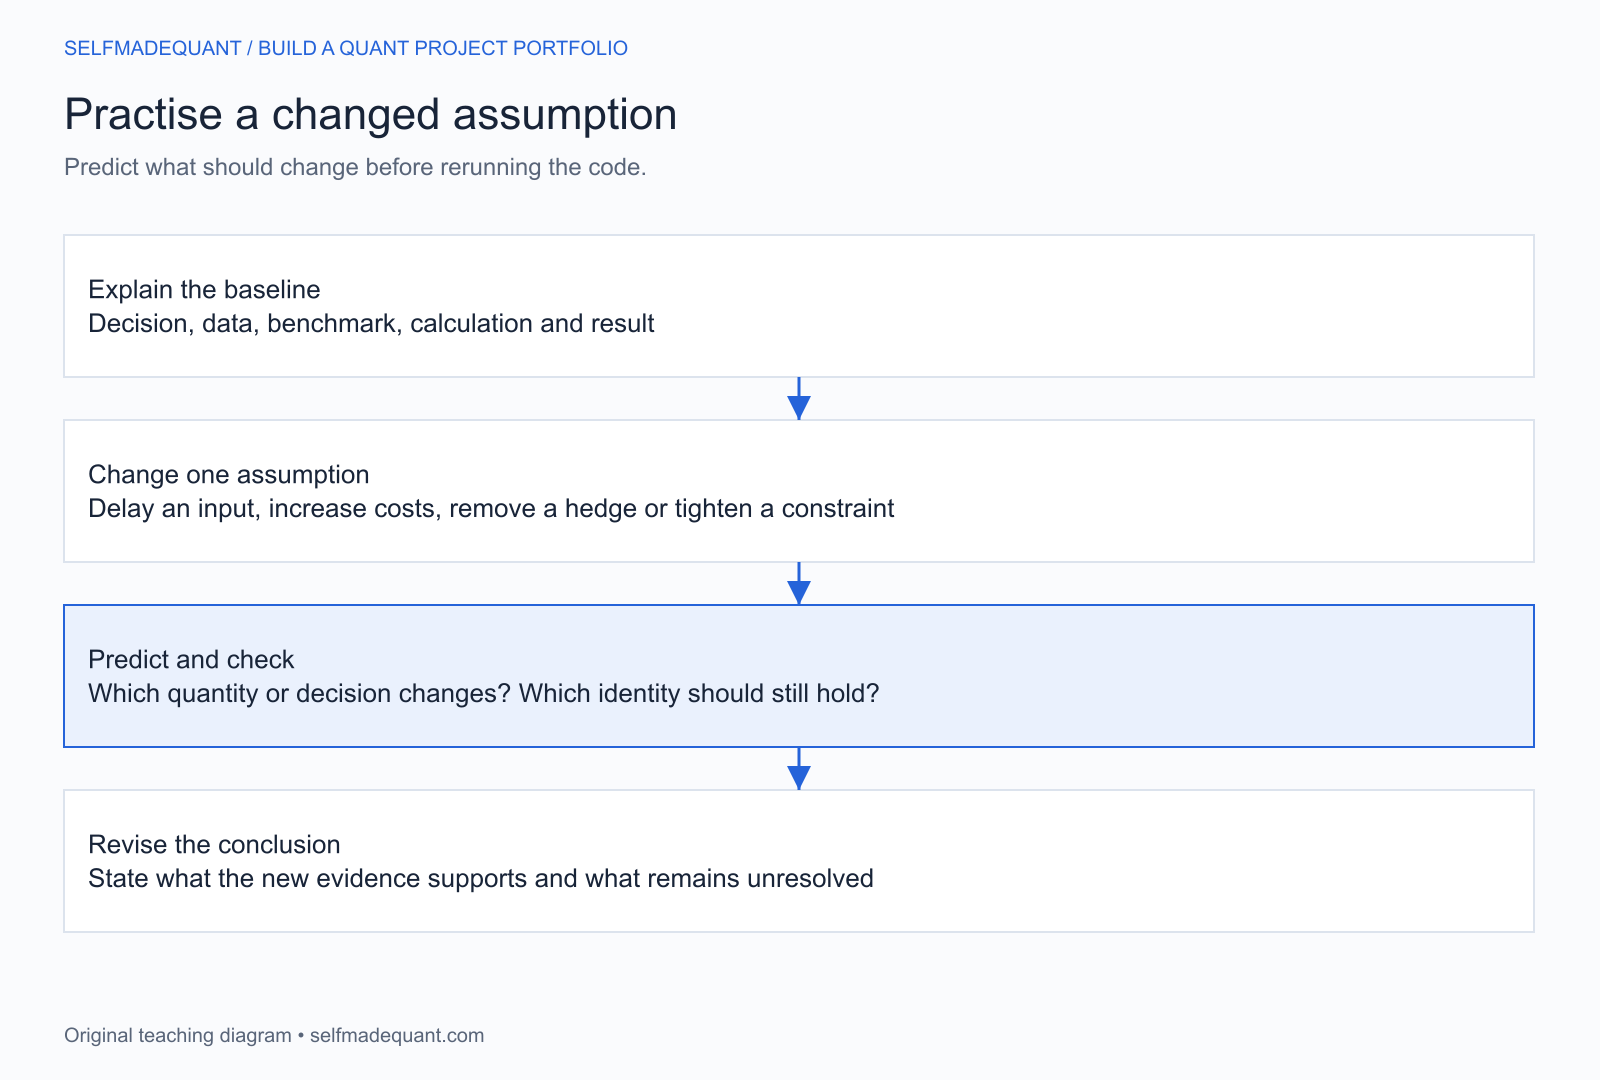
That exercise reveals whether you understand the mechanism behind the figure. If the answer becomes vague, return to the prerequisite lesson rather than memorising more presentation language.
Go deeper with lessons, derivations and worked exercises behind this article.